Goal:
Identify unusual/weird events that have a high chance of being a fraud with credit card transactions.
import pandas as pd
import numpy as np
from sklearn.cluster import KMeans
1: Customer incentive policy
1-1. Aim
Enlarge money flow by automatically increasing their limit
1-2. Method
Identify target users that never went above the monthly credit card limit (calendar month).
general_info = pd.read_csv('./cc_info.csv')
transaction = pd.read_csv('./transactions.csv',parse_dates=['date'])

general_info.head()

transaction['month'] = pd.to_datetime(transaction['date'],format = '%Y%m%d')

transaction['month'] = transaction['month'].dt.month

transaction.head()

## collect monthly amount for each card holder

credit = pd.merge(general_info,transaction,on = ['credit_card'])

credit.head()

task1 = credit.groupby(['month','credit_card']).agg({'credit_card_limit':'min','transaction_dollar_amount':'sum'})

task1.reset_index(inplace = True)

task1 = task1.loc[(task1['transaction_dollar_amount']<=task1['credit_card_limit'])]

over_limit_user = task1['credit_card'].unique()

### Ratio of identified card holders

over_limit_user.size/credit['credit_card'].unique().size

### details for over limit holders monthly transaction which are over amount

print(task1)
      month       credit_card  credit_card_limit  transaction_dollar_amount
0         7  1003715054175576              20000                     162.56
1         7  1013870087888817              15000                     281.43
2         7  1023820165155391              28000                     943.26
3         7  1073931538936472              10000                     220.07
4         7  1087468642191606               3000                     241.60
...     ...               ...                ...                        ...
3791     10  9946917923319410              15000                   10174.10
3792     10  9958678964376192              10000                    5623.22
3793     10  9961694231875562              10000                    5442.72
3794     10  9981251982982618              18000                   12959.72
3795     10  9986135779184360              14000                   11796.95

[3571 rows x 4 columns]
2 : Increase retention
2-1. Aim:
Decrease the punishment by setting a remind for users to pay their bills.
2-2. Method:
Build a function that for each day, returns a list of users who went above their credit card monthly limit on that day
def credit_alarm(date):
    month = date.month
    print(month)
    task2 = credit.groupby(['month','credit_card']).agg({'credit_card_limit':'min','transaction_dollar_amount':'sum'})
    task2.reset_index(inplace = True)
    users = task2.loc[(task2['month'] == month) & (task2['transaction_dollar_amount']>task2['credit_card_limit'])]['credit_card']
    return users.unique()

# test with example: 2015-10-29 18:23:04
date = pd.to_datetime(['2015-10-29 18:23:04'])
credit_alarm(date[0])
10


array([1106824181265726, 1460880989446247, 1749458277555747,
       1934150487562155, 2245942585429940, 2302576486327459,
       2366928097135853, 2505223645294729, 2610112472096585,
       2891791194252089, 2980539633198204, 3138132199016625,
       3264419298955673, 3276369883343727, 3355576223096097,
       3369600965634913, 3370960377586437, 3546693056773873,
       3676109815092640, 3797102737432115, 3929517687134990,
       3936887050542904, 4052848131106690, 4118286032166087,
       4298557099672376, 4318352196714983, 4462290711836916,
       4973517790485920, 5199442973583621, 5257380962581683,
       5488856737032471, 5612235316109460, 5723635641134781,
       5795626689544539, 5899644472359642, 5915891114492596,
       5975270769354417, 5996982621454469, 6174559182308122,
       6198761755487915, 6292410823269309, 6358192544004241,
       6497866359354370, 6766253113444560, 6984795534098127,
       7107467078128879, 7198750113791865, 7214837915436490,
       7238936669483666, 7266500047328736, 7280963829231048,
       7299183791723634, 7324887971716592, 7338934618553557,
       7492940622489570, 7499289351166761, 7545819552904208,
       7556827548313098, 7762807525339038, 7850942767136368,
       7922818627489943, 7924297455503050, 7943675133681182,
       8117664962797683, 8138690656185482, 8522875529951473,
       8660372645853870, 8766575362057055, 8896425420278012,
       8972201384562696, 9143914562725960, 9213346056999744,
       9484591448272784, 9577424157559810, 9632319271199136,
       9727202337611852, 9999757432802760])
3: Fraud Detection
3-1: Aim
detect all transactions that seem unusual and are worth being investigated further
3-2: Method
implement an unsupervised algorithm (PCA + K-Means)
Feature Engineering + PCA + Building Model
### 1. transform register zip code to [longitude,latitude]
from geopy.geocoders import Nominatim
credit['register_place'] = credit['city']+','+credit['state']
credit['trans_place'] = credit[['Lat','Long']].values.tolist()
geolocator = Nominatim(user_agent="custering")
#adding longituede,latitude information to cities
#since we have over 290000 records but only have 124 distinct cities.
cities = credit['register_place'].unique()
df = pd.DataFrame({'name': cities})
from geopy.geocoders import Nominatim
geolocator = Nominatim(user_agent="clustering")
from geopy.extra.rate_limiter import RateLimiter
geocode = RateLimiter(geolocator.geocode, min_delay_seconds=1)
df['location'] = df['name'].apply(geocode)
df['point'] = df['location'].apply(lambda x:[x.latitude,x.longitude] if x else None)
df.head()
#merging back to credit and remove duplicate grographic columns
df = pd.merge(credit[['credit_card','credit_card_limit','transaction_dollar_amount','register_place','trans_place']],df[['name','point']],left_on = ['register_place'],right_on = ['name'])
df['register_place'] = df['point']
df
### 2. calculate the distance between resgiered place and transaction place
from geopy.distance import geodesic
df['distance'] = df.apply(lambda x: geodesic(x['register_place'], x['trans_place']).km, axis=1)
df.head()
def stst_percentile(x):
ps = [25,50,75]
res = np.percentile(x,ps)
return pd.Series(res,index = ['{}%'.format(p) for p in ps])
percent = credit.groupby(['credit_card'])['transaction_dollar_amount'].apply(stst_percentile).unstack()
percent.head()
credit_df = pd.merge(df,percent,on= ['credit_card'])
credit_df.to_csv('./credit_df.csv',index = False)
### 1. Clustering: PCA+ k-means
credit_df.head()
from sklearn.preprocessing import scale
#standarization
feature = ['credit_card_limit','transaction_dollar_amount','distance','25%','50%','75%']
X = credit_df[feature]
X = scale(X)
import matplotlib.pyplot as plt
from sklearn.decomposition import PCA
pca = PCA(n_components=2)
PrincipleComp = pca.fit_transform(X)
x2d = pd.DataFrame(PrincipleComp,columns=['pc1','pc2'])
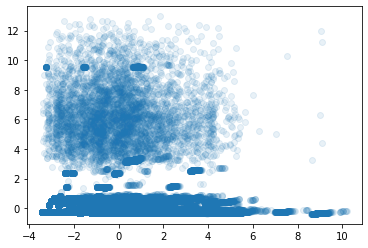
plt.scatter(x2d.pc1,x2d.pc2,alpha = 0.1)
from mpl_toolkits.mplot3d import Axes3D
pca = PCA(n_components=3)
PrincipleComp = pca.fit_transform(X)
x3d = pd.DataFrame(PrincipleComp,columns=['pc1','pc2','pc3'])
fig = plt.figure()
ax = Axes3D(fig, rect=[0, 0, 1, 1], elev=30, azim=20)
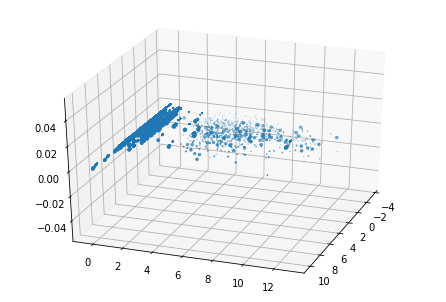
plt.scatter(x3d['pc1'], x3d['pc2'], x3d['pc3'],marker='o')
/opt/anaconda3/lib/python3.8/site-packages/matplotlib/collections.py:886: RuntimeWarning: invalid value encountered in sqrt
  scale = np.sqrt(self._sizes) * dpi / 72.0 * self._factor


<mpl_toolkits.mplot3d.art3d.Path3DCollection at 0x7fa64d01cc10>
Tuning Hyperparameter
#hyperparameter k selection
inertia = []
for k in range(1, 8):
    kmeans = KMeans(n_clusters=k, random_state=1).fit(X)
    inertia.append(np.sqrt(kmeans.inertia_))

plt.plot(range(1, 8), inertia, marker='s');
plt.xlabel('$k$')
plt.ylabel('$J(C_k)$');
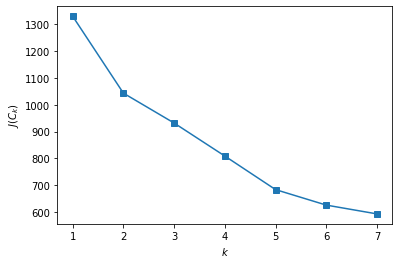
## K-means to cluster


n_clusters = 6
kmeans = KMeans(n_clusters = n_clusters).fit(x3d)

x3d['label'] = kmeans.labels_

x3d['label'].value_counts()

import itertools
colors = itertools.cycle( ['r','g','b','c','m','y','k'] )

fig = plt.figure(figsize = (12,10) )
ax = Axes3D(fig, rect=[0, 0, 1, 1], elev=30, azim=20)
ax.set_xlim3d(-5, 10)
for label in range(n_clusters) :
    temp = x3d.loc[x3d.label == label,:]
    plt.scatter(temp.pc1,temp.pc2,temp.pc3, c=next(colors),label=label,alpha=0.3,marker='o')

plt.legend(loc='best')
plt.show()
/opt/anaconda3/lib/python3.8/site-packages/matplotlib/collections.py:886: RuntimeWarning: invalid value encountered in sqrt
  scale = np.sqrt(self._sizes) * dpi / 72.0 * self._factor
/opt/anaconda3/lib/python3.8/site-packages/matplotlib/collections.py:886: RuntimeWarning: invalid value encountered in sqrt
  scale = np.sqrt(self._sizes) * dpi / 72.0 * self._factor
/opt/anaconda3/lib/python3.8/site-packages/matplotlib/collections.py:886: RuntimeWarning: invalid value encountered in sqrt
  scale = np.sqrt(self._sizes) * dpi / 72.0 * self._factor
/opt/anaconda3/lib/python3.8/site-packages/matplotlib/collections.py:886: RuntimeWarning: invalid value encountered in sqrt
  scale = np.sqrt(self._sizes) * dpi / 72.0 * self._factor
/opt/anaconda3/lib/python3.8/site-packages/matplotlib/collections.py:886: RuntimeWarning: invalid value encountered in sqrt
  scale = np.sqrt(self._sizes) * dpi / 72.0 * self._factor
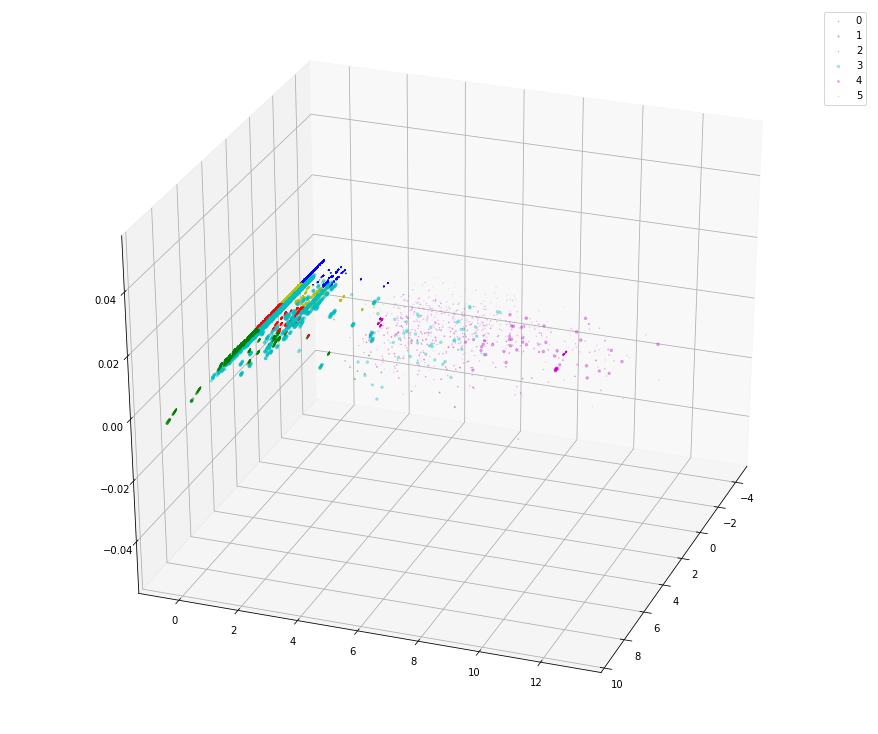
## check the distribution of x3d labels

x3d.label.value_counts()
5    113127
2     73124
0     70056
1     27449
4      5445
3      5387
Name: label, dtype: int64
Comparing the distribution of two core features among classified two clusters
suspicious_label=4
suspect = credit_df.loc[x3d.label ==4]
suspect.to_csv('./suspect',index = False)
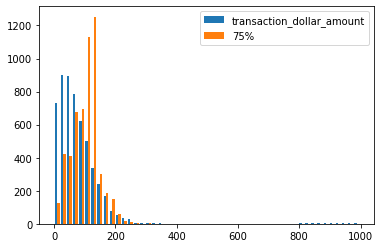
cols = ["transaction_dollar_amount",'75%']
plt.hist(suspect.loc[:,cols].values,bins=50,label=cols)
plt.legend(loc='best')
plt.show()
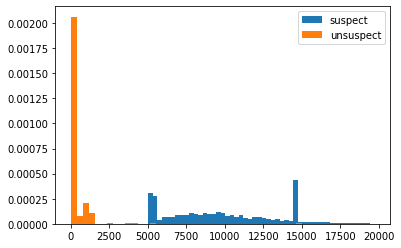
unsuspect = credit_df.loc[x3d.label !=3]
plt.hist(suspect.loc[:,['distance']].values,bins=50,density = True,label = 'suspect')
plt.hist(unsuspect.loc[:,['distance']].values,bins=50,density = True,label = 'unsuspect')
plt.legend(loc='best')
plt.show()
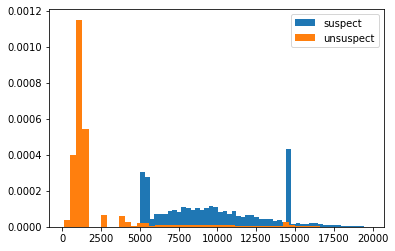
### deleting 0 distance and replot
unsuspect = unsuspect.loc[unsuspect.distance>100]
plt.hist(suspect.loc[:,['distance']].values,bins=50,density = True,label = 'suspect')
plt.hist(unsuspect.loc[:,['distance']].values,bins=50,density = True,label = 'unsuspect')
plt.legend(loc='best')
plt.show()
quantify the effect of fraud transactions
#ratio of suspectious fraud transactions
suspect.shape[0]/credit_df.shape[0]*100
1.8483441280703898
#total amount of suspectious fraud transactions
suspect['transaction_dollar_amount'].sum()
444493.55000000005
non-parametric & parametric tests
Aim: check whether the mean of suspect and non-suspect team are different.
#for diatance
dis_x = suspect['distance']
dis_y = unsuspect['distance']
#z-test
from statsmodels.stats.weightstats import ztest
r1 = ztest(dis_x,dis_y)
print(r1)
#Mann Whitney U Test
from scipy.stats import mannwhitneyu
r2 = mannwhitneyu(dis_x,dis_y)
print(r2)
(184.11775527497144, 0.0) MannwhitneyuResult(statistic=14921897.5, pvalue=0.0)
#for total_amount
dis_x = suspect['transaction_dollar_amount']
dis_y = unsuspect['transaction_dollar_amount']
#z-test
from statsmodels.stats.weightstats import ztest
r1 = ztest(dis_x,dis_y)
print(r1)
#Mann Whitney U Test
from scipy.stats import mannwhitneyu
r2= mannwhitneyu(dis_x,dis_y)
print(r2)
(11.961471627328077, 5.655073132421734e-33) MannwhitneyuResult(statistic=137735388.0, pvalue=1.5637055034033401e-15)